Jen and Barry’s Ice Cream Shop Site-Selection Scenario
Lesson criteria:
In this first lesson, we are asked to complete a series of tasks as part of a site-selection project. This is the first lesson in the course, and it is intended to quickly introduce us to a number of concepts. We gain some familiarity with ArcGIS Pro, the software we’ll be using in the class, we are introduced to a basic GIS workflow that we can iterate on for future projects, and we learn about some of the analysis that we might use when performing site selection (King, Walrath, & Zeiders, 1999–2026).
Project goals and objectives:
For the project, we were given a scenario. Jen and Barry want to start an ice cream business in Washington state, and need help finding a location that meets a set of criteria. It must have a large number of dairy farms nearby, a large population of working-age individuals, and be within 10 miles of an interstate. It must have a low crime rate, be close to a park, not be too densely populated, and be close to an airport. Our objective was to identify a location that met the criteria.
The process:
In the first part of the lesson, we focused on preparing the data and setting up the project in ArcGIS. This involved learning about file management, file types (shapefiles), and how to sync our folders to ArcGIS’s catalog panes. We set up a new map, added data in multiple ways, and updated the coordinate system to use GCS North American 1983 HARN. I used the symbology panel to edit how the data was displayed, trying to make it high contrast.
In the second part of the lesson, we started the site selection exercise. In each step, we narrowed down the selection into fewer candidates. One of the datasets added was the counties in Washington state, along with relevant attributes on dairy count, population density, and ages between 18 and 64. This is possible with the Select By Attributes tool, which lets you build WHERE clauses using a wizard. It was important to select “AND” between clauses to make sure that all of the relevant county attribute logical operators were evaluated. In the next step, we used a spatial query to narrow down our selection. The select by attributes tool is effective for using attributes in the data to filter, but a spatial query allows you to do this using the location data of the row. There are different relationships you can use, and in this step, our query selected all of the cities that appeared entirely within the filtered counties. Next, I ran a few more attribute queries to select cities within 40 miles of an airport, and then with a crime index of <= 50.
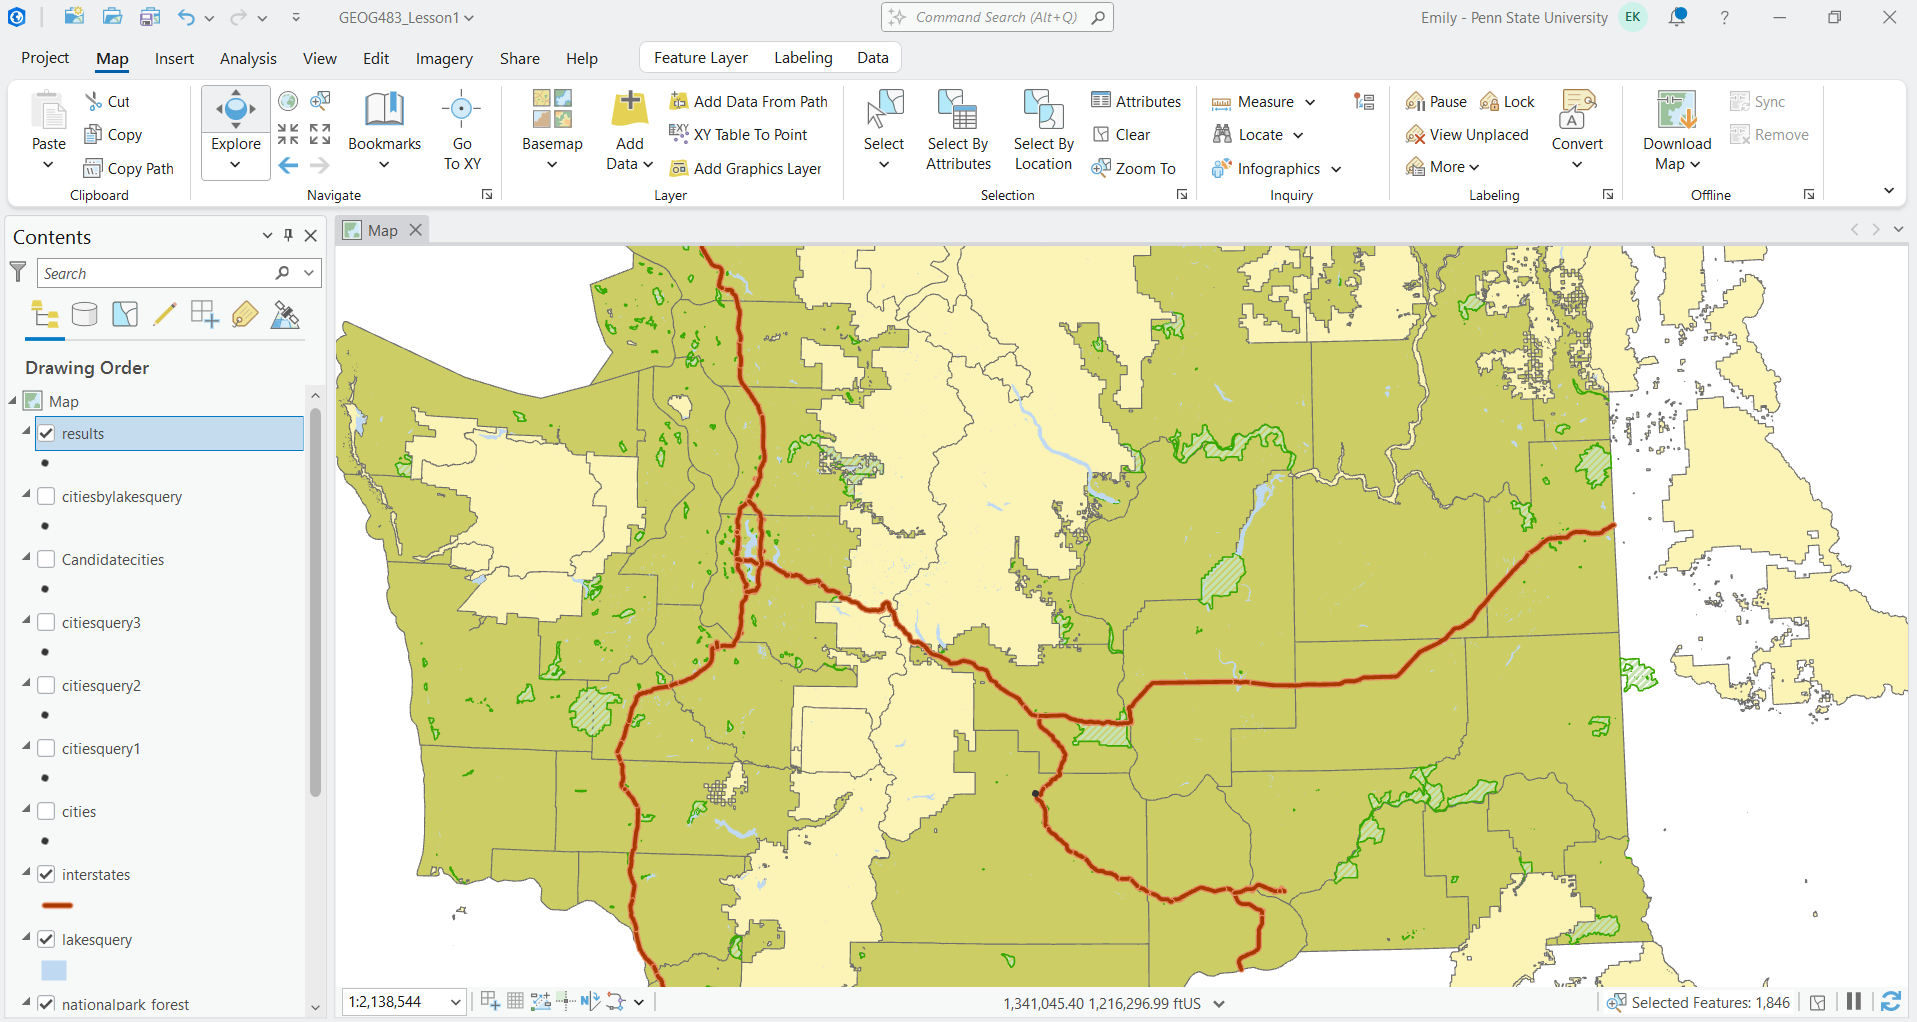
Another relationship option for the spatial query is within a distance geodesic. This allows you to search for an input feature within a specified distance of another feature. In this case, we filtered down our cities to only those that would appear within 10 miles of an interstate. At this point, I was feeling confident that I could step through the analysis steps, since they were spelled out for me. In the next step, however, we were asked to filter further to only include cities within 10 miles of a park, but were not told specifically how to do this. This was good because it made me think harder about what I was actually doing, rather than just following directions mindlessly. At this point, my initial map was complete, with five candidate cities (see figure 1). This can be handed off to Jen and Barry to make the final decision on where they’d like to place the business.
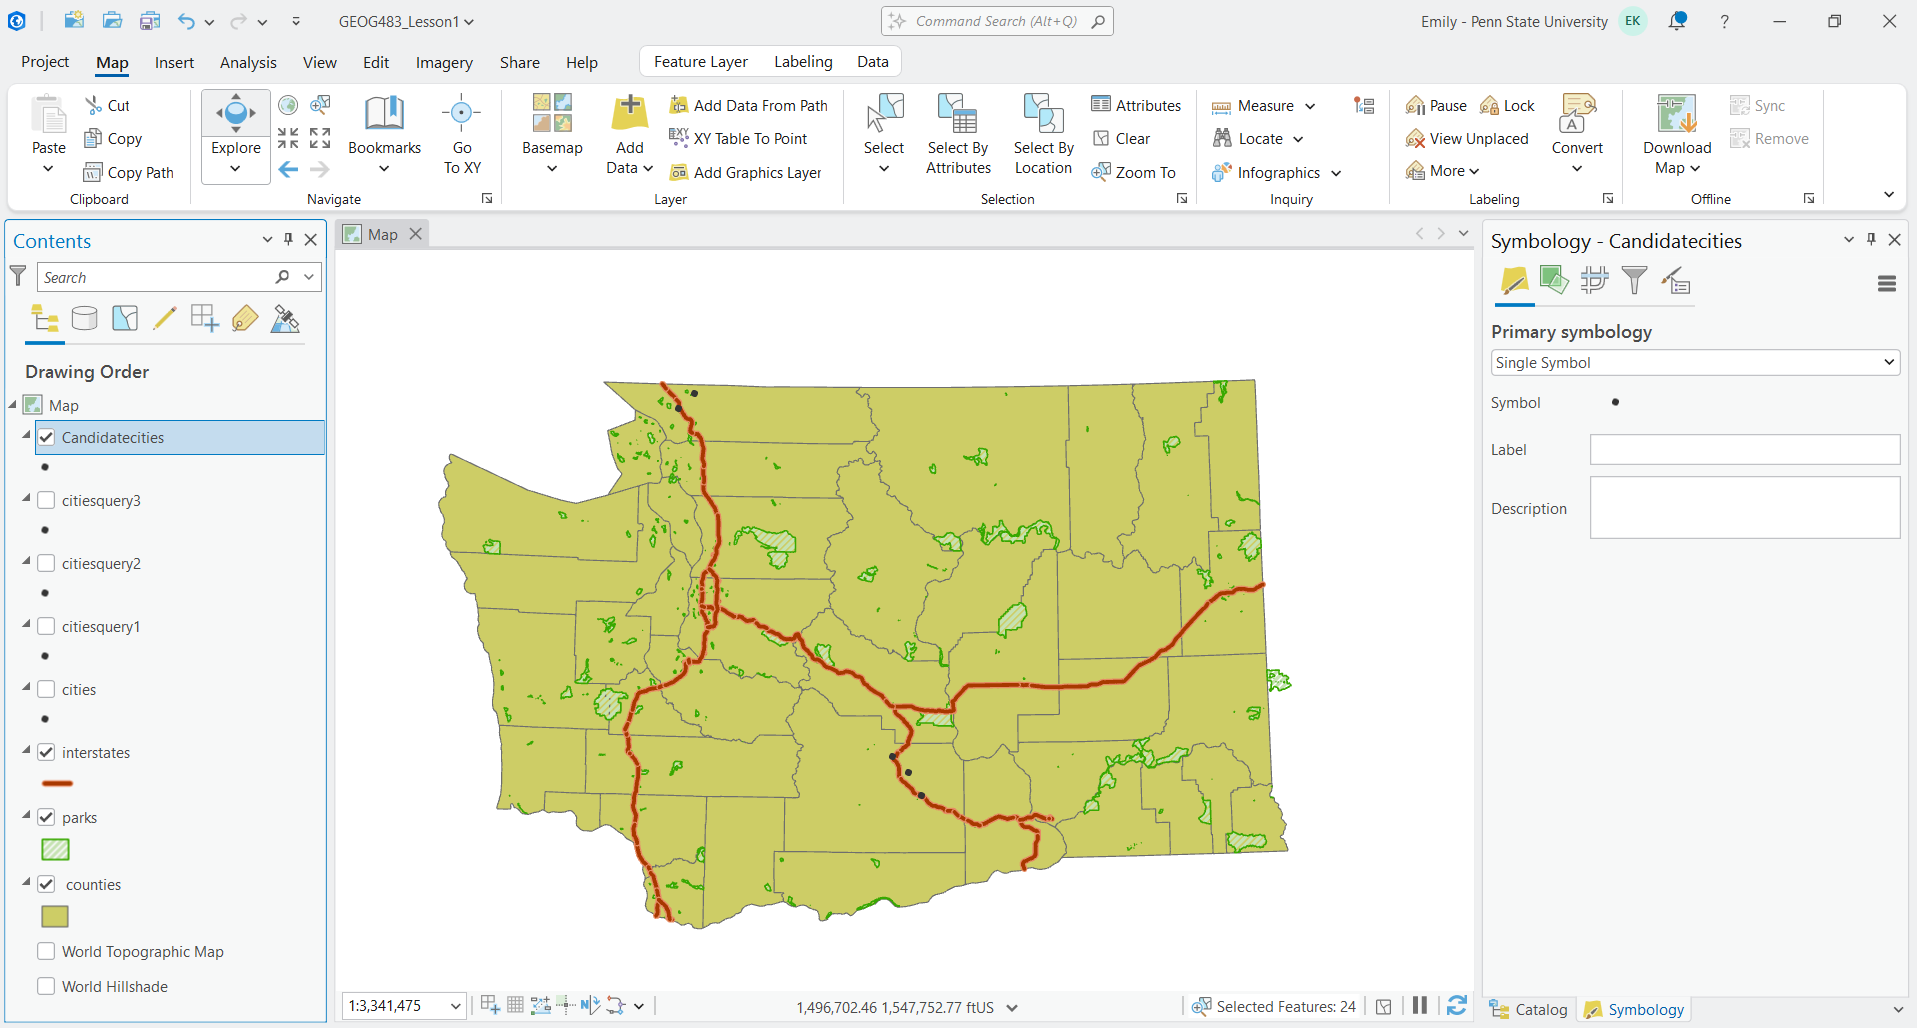
Figure 2 - This screenshot includes a map of Washington, interstates, parks, and outlined counties, as well as the one remaining candidate city for Jen and Barry’s new ice cream shop, after filtering by cities that are close to a National Park Unit or US Forest, and within 10 miles of a lake. The light yellow shows the newly added National Park layer, although the data does spill over the edges of the counties layer. It was generated in ArcGIS Pro on March 1, 2026, by Emily Kauffman as part of the Lesson 1 site-selection project.
Analysis:
Although I’m new to GIS, I can see that this was a simple example, with all of the data provided in an appropriate format. The steps were well-defined and straightforward. I will be interested going forward in seeing how this data may have been prepared, or where it came from. One of the concepts I’d like to improve on in this class is understanding the GIS process, from the collection of the data, to cleaning the data, and eventually producing it in a format that can be used by ArcGIS.
I found it useful to save “chunks” of work as new layers so that it’s easier to check correctness as you go along. I ended with four city layers, each filtered down slightly more than the previous. The project stated that you could have simply piped the input from one analysis to the next without this step, but it was evident that making the temporary layers creates checkpoints in which to pause work, confirm correctness, and identify where issues were introduced.
Another thing to consider is the logical operators in the analysis widget. We could have gotten different results if we switched an AND operator to an OR. This shows the importance of listening to a client carefully, and confirming. To me, it was strange to want a place that is both near a state park and a national park or forest. I would have thought this would be an OR statement, if their end goal was simply to be near a park.
Additional spatial data that would have been helpful in this project would be a dataset that showed existing ice cream businesses so that we could make sure they choose a location that is not already oversaturated with ice cream shops.
Additional Exploration
The last step I took in the project was to play around with some ArcGIS features, like adding labels and exporting to a PDF. I was able to add a label to TryThis map to show the client that Selah was the final candidate city suggestion. I found export settings within the Share tab, and exported it as a geotiff. I tried to copy and paste that into the Google doc in which I’m writing this report, but it was not a supported format. I did not see an option to export as a PNG or JPEG, so I went searching again. I found an option to Download Map, and surprisingly, this added a topographic map layer to my legend!
After removing that layer, I just used the Windows Snipping Tool to take a screenshot, which produced Figure 3 below. I wanted to add a legend as well but had trouble getting that to show up. This is something I’d like to explore in the rest of the class.
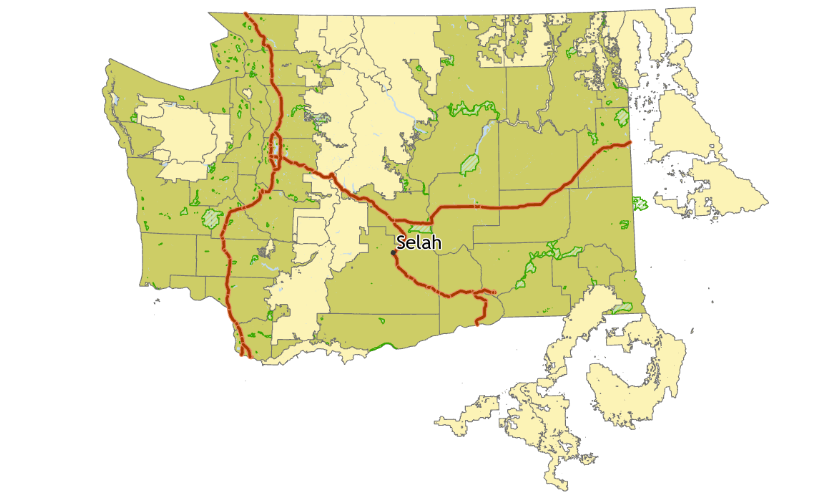
Figure 3 - This is a screenshot of my final result of the Washington State map. It shows the counties, interstates, parks, and assorted layers generated from analysis, but also includes the labeled final candidate city of Selah. It was generated in ArcGIS Pro on March 4, 2026, by Emily Kauffman as part of the Lesson 1 site-selection project.
References
King, E., Walrath, D., & Zeiders, M. (1999-2026). Problem-Solving with GIS, Lesson 1, Industry: Business, Lesson 1 Introduction and Action List. The Pennsylvania State University World Campus Certificate/MGIS Programs in GIS. Retrieved March 1, 2026.